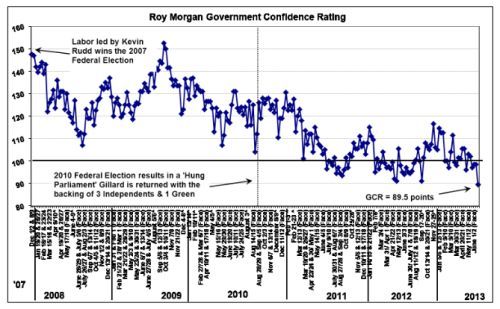
I found a graph with squiggles on it
- Mark as New
- Bookmark
- Subscribe
- Mute
- Subscribe to RSS Feed
- Highlight
- Report Inappropriate Content
on 17-06-2013 09:04 PM
I must admit, zilch research - sorry monman (hope you like it)
http://www.roymorgan.com.au/~/media/Files/Findings/2013/June/4973-Fed-Vote-June18.pdf

- Mark as New
- Bookmark
- Subscribe
- Mute
- Subscribe to RSS Feed
- Highlight
- Report Inappropriate Content
on 17-06-2013 09:42 PM
- Mark as New
- Bookmark
- Subscribe
- Mute
- Subscribe to RSS Feed
- Highlight
- Report Inappropriate Content
on 17-06-2013 09:44 PM
Well the graph I researched had better colours.
Can you add some highlights John?
- Mark as New
- Bookmark
- Subscribe
- Mute
- Subscribe to RSS Feed
- Highlight
- Report Inappropriate Content
on 17-06-2013 09:51 PM
- Mark as New
- Bookmark
- Subscribe
- Mute
- Subscribe to RSS Feed
- Highlight
- Report Inappropriate Content
on 17-06-2013 09:54 PM
If you need squiggle explanations, you would be better asking DLA. I think DLA's grasp, and yours, of the Scientific Method ( and interpretation) would be parallel !
- Mark as New
- Bookmark
- Subscribe
- Mute
- Subscribe to RSS Feed
- Highlight
- Report Inappropriate Content
on 17-06-2013 09:57 PM
Who is DLA?
Are you struggling with humour or is it old age?
- Mark as New
- Bookmark
- Subscribe
- Mute
- Subscribe to RSS Feed
- Highlight
- Report Inappropriate Content
on 17-06-2013 10:04 PM
I see your admission : "I must admit, zilch research" is certainly correct.
Conduct some basic research, search term: DLA.
- Mark as New
- Bookmark
- Subscribe
- Mute
- Subscribe to RSS Feed
- Highlight
- Report Inappropriate Content
on 17-06-2013 10:08 PM
I am just happy to have progressed from DH to DY
lol, you could try being nice to females Monman and we might believe you can fly planes 😄
I can't possibly believe it without proof.
Night All 🙂
- Mark as New
- Bookmark
- Subscribe
- Mute
- Subscribe to RSS Feed
- Highlight
- Report Inappropriate Content
on 17-06-2013 10:11 PM
One is only concerned with someone's opinion if you respect it.
- Mark as New
- Bookmark
- Subscribe
- Mute
- Subscribe to RSS Feed
- Highlight
- Report Inappropriate Content
on 18-06-2013 06:30 AM
Oh MM......coming from the man who still believes the hockey stick graph is correct....lol...still licking your wounds?......you really don't like losing an argument do you....... ;-):^O
____________________________
"High and low pressure systems cause the day-to-day changes in our weather." ...Metoffice.......
siggie-reported-by-alarmists..............
